Sensor integration and monitoring
Know what your sensors are telling you.
METR brings signals from sensors, PLCs and other equipment into one reliable picture and checks how far each signal can be trusted. It works on its own or as the data foundation for an AI assistant.
Data visualisation
Put data in its physical context.
METR presents operational and sensor data in dashboards, charts and visual site overviews. By linking measuring points to buildings, rooms and equipment, we make it easier to see where information belongs and what needs attention.
Explore the model, day/night views and lighting. Visual demo without live data.
Drone photogrammetry
From drone images to a digital site overview.
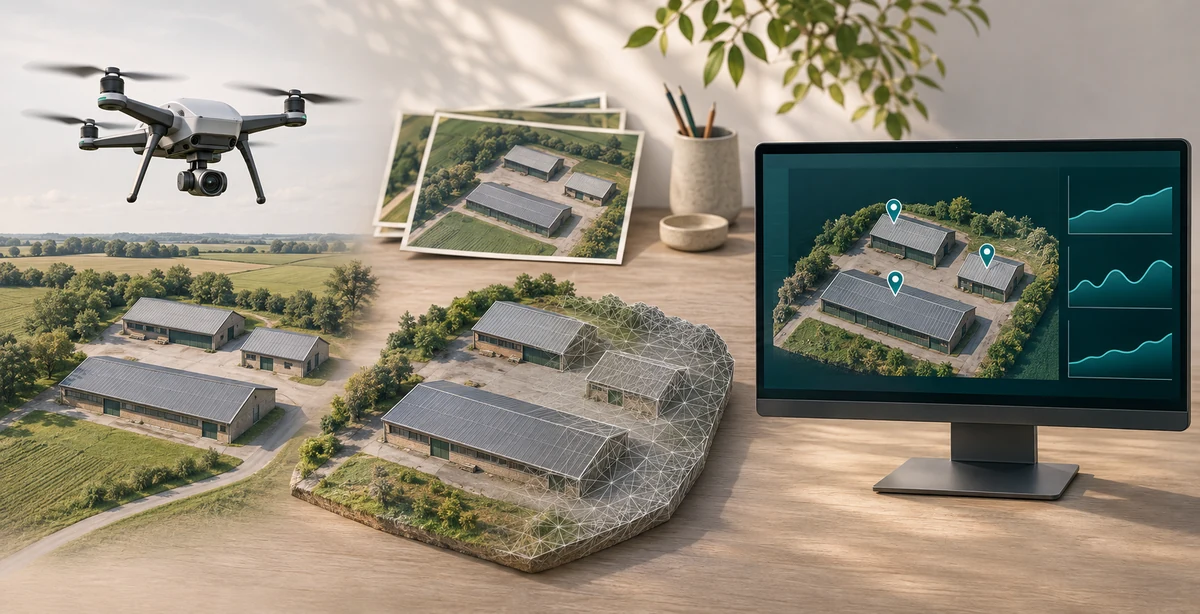
METR carries out drone photogrammetry, turning overlapping aerial photographs into detailed 3D models of buildings and sites.
-
Connect the model to operational data
The models can form the basis of an interactive site overview, linking measuring points, equipment and sensor data to their physical locations. This provides a coherent view of the site — from the buildings' form to operational data and trends over time.
-
A standalone service or part of a complete solution
Photogrammetry can be delivered as a standalone service or as part of a complete solution with sensor integration and dashboards.
AI and data security
Your data. Your AI. Your control.
METR connects your business systems and operational data to AI — locally, in the cloud or in combination. We build integrations through APIs and MCP (Model Context Protocol), giving the AI assistant access to relevant, up-to-date information within the access rights you have approved.
-
From measurement to useful answer
We connect sensors, databases, documents and business systems. This gives AI the context it needs to answer questions and support staff in their work — without giving it unrestricted access to the entire business.
-
Security is part of the architecture
We specialise in secure system integration. We limit data access, separate systems and design the solution so you control which information AI may use and where it is processed.
-
Confidential data can stay with you
When information must not leave your business, we build the solution with local AI and local data processing. If cloud AI is included, we limit which data may be sent and exclude or anonymise confidential information according to the agreed requirements.
What we do
From scattered signals to one picture.
-
Integration across systems
We connect sensors and operating values from PLC and SCADA systems, local controllers such as ventilation, pumps and heating, edge devices, gateways and third-party platforms.
-
Reliable data capture
Time-synchronised measurements, buffering and fail-safe logging, secure transport and storage, and consistent naming and tagging.
-
Sensor validation
Checks for missing signals and lost communication, drift and plausibility, consistency between sensors, and calibration tracking.
-
Dashboards and alerts
Views built for action: current status, alarms and events, trends, and separate views for operators and management.
-
Evaluation and improvement support
Baseline modelling, efficiency tracking and detection of waste such as heat loss, standby consumption or poor scheduling, with support for implementing improvements.
How a project runs
From survey to useful views.
-
Map the signals
We list the sensors, controllers and systems that hold the data and agree what you need to see.
-
Connect and validate
We connect the sources, capture the data reliably and check it for faults and drift.
-
Show and improve
We build views for the people who act on the data and support improvements based on what they show.
Works with
Part of a larger system, or on its own.
-
AI systems
Assistants connected to your knowledge, data and systems.
-
Automation and industrial systems
PLC, SCADA and control, connected to the rest.
-
Embedded electronics development
Firmware, circuit boards and interfaces for devices that must work.
First conversation
Let’s talk about your project.
Tell us what you want to build, connect or understand. We will help you find a bounded first step.